
Singapore HDB Rental Market 2026: Top Towns For High Yields, Key Strategies & Tools For Maximising Passive Income In Jurong, Toa Payoh, Geylang And More
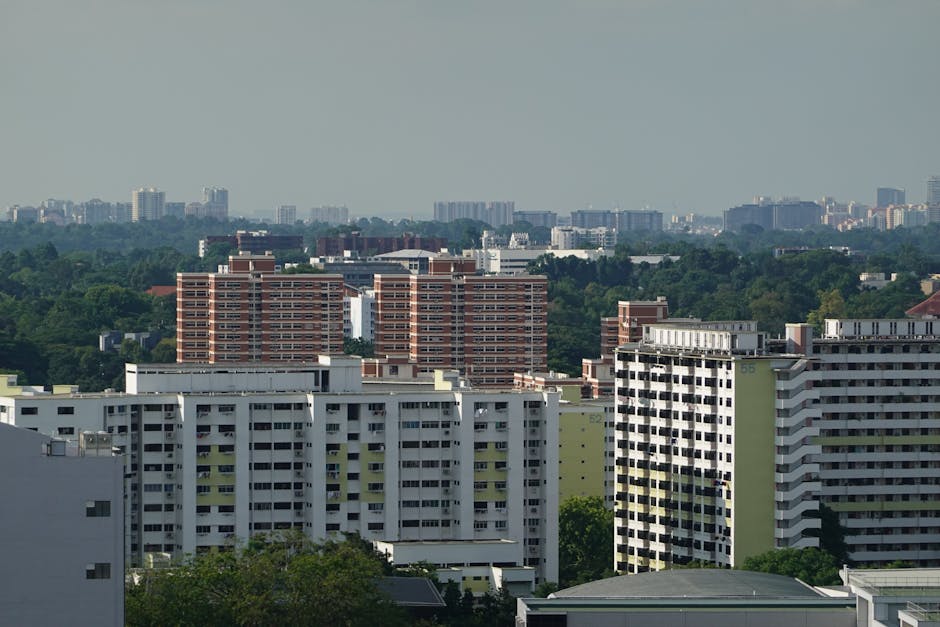
Singapore’s HDB Rental Market 2026: Opportunity at the Plateau
Singapore’s public housing landscape has undergone a seismic evolution over the past decade, transforming from a symbol of secure homeownership to a contemporary engine for passive income and wealth creation. In 2026, as the city-state’s rental market stabilises after the pandemic-era surge, the focus has shifted from speculative gains to sustainable yield. Market guides and dashboards now show HDB rental yields across many towns at 5.5–8%, with star performers like Jurong West, Toa Payoh, and Geylang consistently surpassing 8% gross. This exposes a unique window for Singaporean households and small investors—if they are ready to navigate the shifting terrain of regulation, tenant demand, and data-driven strategy.
The State of HDB Rental Play: From Surge to Sustainable Yield
Historic Volatility Gives Way to Yield Stability. The explosive rental market of 2022–2023 is now a memory, replaced by a more measured landscape. According to ERA’s 1Q2026 Rental Report, HDB rents in 2026 are at historic highs but have entered a stabilisation phase. Median rents nudged higher across most flat types—3-room (+1.1% QoQ), 4-room (+0.9%), 5-room (+0.6%), with a slight dip for executive flats (−0.4%). Rental applications mirrored this resilience, with Q2 2026 approvals rising 4.9% from Q1 but showing only a marginal −0.6% drop year-on-year, underscoring a steady demand base.
Plateau, Not Precipice. These numbers signal a market settling into a “new normal.” As a DollarsAndSense 2026 rental yield guide highlights, industry commentary expects rent growth to be capped at roughly 1% for the year, with some peripheral estates softening by 1–2% as supply increases. Around 13,500 flats reaching their Minimum Occupation Period (MOP) in 2026 are adding stock, but not enough to provoke an oversupply scenario. This stabilisation shifts the game: it’s less about chasing the next big rental spike and more about extracting consistent, risk-managed income.
Gross Yields Pull Ahead of Alternative Assets. In an environment marked by global uncertainty and modest local inflation, HDB rentals now anchor themselves as a yield play. Gross yields of 5.5–8% across many towns outpace fixed deposit rates and CPF returns, especially when deployed with strategic acumen and regulatory discipline.
Mapping the Yield Landscape: Where the Income Lives
Town-Level Variation Tells the Real Story. Not all HDB towns are created equal. Data from town-level yield dashboards reveal that seemingly small shifts in location, transport access, and supply-demand balance can double or halve yield potential.
- Top Performers: Toa Payoh (≈9.4% gross on 3-room units), Geylang (≈8.8%), and Jurong West (≈8.4%) set the benchmarks for “income engine” strategies. Average 3-room yields across Singapore track around 7.5%.
- 4-Room “Sweet Spot”: Jurong West (≈7.6%), Jurong East, and Choa Chu Kang dominate the mid-sized segment.
- The Defensive Belt: Towns like Marine Parade, Ang Mo Kio, Yishun, Bedok, Woodlands, and Sembawang offer stable but lower yields (6.2–6.8%), while Pasir Ris, Sengkang, Serangoon, Punggol, and Tampines cluster towards 5.7–5.8%.
Why the West and Central Fringe Lead. Jurong East and West benefit from proximity to the emerging Jurong Lake District, robust transport, and an established tenant pool of professionals and students seeking value. Toa Payoh and Geylang, meanwhile, blend central-like amenities with more approachable resale prices, attracting yield-focused investors drawn by strong rental demand but moderate entry costs.
Yield Compression in “Young Family” Towns. Locations like Punggol, Sengkang, Tampines, and Pasir Ris, popular with owner-occupiers and upgraders, have seen resale prices outpace rental growth, leading to subdued gross yields in the high-5% range. These towns remain appealing for defensive or hybrid strategies, but lack the “income engine” firepower of the west or mature fringe.
Structural Drivers Shaping 2026’s Rental Resilience
Delayed Supply Absorption, But No Crash. Despite the addition of 13,500 MOP flats this year, supply has not yet overtaken demand. New completions are absorbed by strong flows of tenants—foreign professionals, families in transition, and locals awaiting BTO keys—ensuring that rental stock grows, but not so fast as to drive rents down sharply.
Negotiating Power Shifts to Tenants—But Not Universally. The steady flow of new supply is finally giving some leverage back to renters, especially in fringe towns where competition is increasing. Yet, in high-demand nodes like Jurong or central fringe estates, landlord pricing remains firm due to consistently healthy tenant pools.
Steady Approvals Signal Robust Demand. The Q2 2026 market saw HDB rental applications tick up to 10,002 (up 4.9% from Q1) and the stock of rented flats increase to nearly 59,000. There is no evidence of a dramatic exit from renting, reinforcing the market’s ability to withstand minor shocks. (HDB Pulse: 1Q2026 RPI)
Comparative Perspectives: Income-Seeking Investor vs. Owner-Occupier Landlord
1. The Yield-Seeking Investor. For the financially-savvy, relatively mobile household, the model is clear: own a flat primed for full-unit rental in a high-yield town, move out after MOP, and extract 6–9% gross yield. This means aggressive benchmarking, careful cost control, and active lease management. The risk? Policy changes, vacancy periods, and potential tax hikes.
2. The Owner-Occupier Landlord. For others, the goal is to supplement income with room rentals while retaining the comfort and stability of their primary home. This strategy is more accessible, less exposed to regulatory shifts, and often delivers higher per-square-foot income (especially near transport hubs), but at a smaller scale overall.
3. Defensive or Hybrid Owners. In towns with low to mid-tier yields (Punggol, Sengkang), the rental is a bonus rather than a core financial pillar. Here, execution and preservation of capital are paramount—net returns may trail “income engine” towns, but so does risk.
The great passive income opportunity in HDB rentals now lies not in speculative rent growth, but in the disciplined curation of high-yield, policy-compliant assets—a shift from the hunt for capital gains to the science of sustainable, inflation-linked cashflow.
Regulatory Constraints: The Hard Lines That Shape Strategy
No Strategy Without Compliance. HDB’s regulatory regime is non-negotiable. Owners must occupy their flat for five years (MOP) before entire-flat rental is allowed. Renting out a whole flat generally requires at least one Singapore Citizen; Permanent Residents face stricter limits. Tenancies shorter than six months are banned, and there are occupancy caps by flat size. Every whole-unit lease must be registered via HDB’s official portal. Non-compliance exposes owners to enforcement and even flat repossession.
Room Rentals: The Low-Hanging Fruit. Owner-occupiers can typically rent out spare rooms more flexibly, allowing households to test the rental waters or offset cost of living pressures—even before their first MOP.
Practical Playbook: How Households Turn HDB Equity Into Income
Step 1: Clarify Your Role
Are you an owner-occupier landlord seeking supplementary income through room rental, or a dedicated income-seeker looking to rent an entire flat after MOP? This choice determines your regulatory obligations, risk exposure, and the scale of potential income.
Step 2: Benchmark Rents with Official Data—Not Hearsay
Use HDB’s online Market Rental Rates tool to check real, recent transacted rents by block, town, and flat type. Pair this with portal-based dashboards (e.g., HDBData) to map your potential gross yield—[(annual rent ÷ purchase price) × 100]. This evidence-based approach guards against over-optimism or underpricing.
Step 3: Calculate Net—Not Just Gross—Yields
Gross yields of 7–9% sound compelling, but must be discounted for:
- Higher property tax (for non-owner-occupiers)
- Monthly maintenance and sinking funds
- Vacancy and leasing agent costs (budget 1 month per year vacant, plus commissions)
- Insurance, minor capex, and compliance-related admin
Step 4: Select Towns That Marry Yield and Occupancy
Aggressive yield-seekers should target Jurong East/West, Toa Payoh, Geylang, and central fringe towns. Success rests on proximity to MRTs, job nodes, and amenities. Balanced investors might prefer Ang Mo Kio, Bedok, Marine Parade, or the northern towns for smoother occupancy and more diverse tenant pools. Defensive investors may prioritise northeast “young family” towns, accepting lower yields in exchange for lower volatility and potential future owner-occupation.
Step 5: Set Price, Structure Leases, and Vet Tenants Proactively
Data-driven pricing (midpoint of recent transacted rents), longer initial tenancies with escalation clauses, and disciplined tenant screening (stable employment, good rental history) help ensure both income and asset care. In slow-growth markets, minimising vacancy and maintenance risk is as critical to return as chasing top-line rent.
Step 6: Integrate Rental Strategy With Family Balance Sheet
Treat the HDB rental as a portfolio asset: compare net yield to CPF, fixed income, or alternative investments; plan for liquidity and policy risk; and integrate into retirement and legacy planning. Periodic stress testing—assuming 10–20% rental cuts or tax hikes—instills resilience and guards against over-extension.
Innovative Tactics and Emerging Practices
Data Is the New Landlord’s Best Friend. The rise of HDB’s official analytics portals and third-party dashboards has enabled households to benchmark rent and yield down to the block cluster—shrinking the gap between professional and “mom and pop” operators. Advanced users are building custom yield trackers, back-testing strategies using downloadable datasets from Data.gov.sg, and integrating these insights into balance sheet analysis.
Leveraged But Prudent Finance. While HDB financing is typically conservative, some higher-net-worth households use modest leverage to amplify returns—always stress-tested against downside scenarios and regulatory tightening.
Professionalisation of Landlordship. The most successful “income engine” players now treat HDB rentals like a business: tracking P&L, planning for scheduled capex and minor renovations, and prioritising tenant experience. Small gains in efficiency, tenant selection, or maintenance can add 1–2 points to net yield over time.
Comparative Segment: Newcomers vs. Seasoned Operators
The New Entrant’s Dilemma: For young couples or first-time upgraders, the world of HDB rentals can appear daunting—regulatory compliance, eligibility constraints, and yield calculations all present a steep learning curve. Their natural advantage is flexibility: many are still eligible for first-time grants, can optimise for room rentals, and are less exposed to “lock-in” risk if policy shifts.
The Seasoned Investor’s Edge: Established landlords, often with multiple properties, benefit from experience, scale economies, and deep knowledge of HDB’s evolving rules. They tend to operate in the highest-yielding towns, deploy professional leasing agents, and are faster to pivot strategies as market conditions or policy winds shift.
The Common Ground: Both must adapt to the “new plateau”—where sustainable returns depend not on rent spikes, but on mastery of data, compliance, and risk management. The gap is closing, but the best results will accrue to those who blend agility with discipline.
Digital Tooling: The “Must-Use” Sites for HDB Rental Success
- HDB’s Flat Portal & MyHDBPage: Critical for eligibility checks, asset management, and rental registration. (HDB official site)
- Market Rental Rates Tool: The most authoritative price benchmarking, updated regularly with contract-level data. (Check here)
- Open Datasets: Data.gov.sg for custom analysis and back-testing yields.
- Dashboards and Yield Guides: Sources such as HDBData and DollarsAndSense 2026 guides for town and flat-type benchmarking.
- Major Portals: PropertyGuru’s MOP 2026 coverage and 99.co’s research dashboards for trends, analytics, and comparative listings.
Tactical Recommendations for Decision Makers in 2026
- Build on Net Yield, Not Speculation. Assume 1% rental growth (with downside risk at fringes), and pursue only flats that clear your net-yield hurdle after all costs.
- Target Top-Performing Towns for Passive Income. Jurong West, Jurong East, Toa Payoh, Geylang, Ang Mo Kio, and Bedok consistently offer 6–8% gross yields; focus your search here for the best risk-adjusted returns.
- Leverage Official Data Aggressively. Make HDB’s Market Rental Rates and quarterly stock data your primary lens; supplement with third-party dashboards for additional perspectives.
- Finance Conservatively, Stress Test Regularly. Modest gearing can boost returns—provided you are prepared for shocks in rent or tax policy.
- Adopt a Professional, Data-Driven Mindset. Treat your HDB flat as an enterprise; detailed tracking, proactive maintenance, and flexible tenant management are key to stable long-term income.
- Plan for Policy Change and Life Events. Integration with family goals, retirement timelines, and housing policy eligibility must anchor long-term strategies.
Conclusion: The Strategic Arc of HDB Rental in 2026 and Beyond
The Singapore HDB rental market in 2026 is not a playground for speculation, but a canvas for disciplined, data-driven value creation. As yields plateau and growth moderates, only those who anchor their strategies in official data, regulatory compliance, and focused asset management will reap sustainable rewards. Yields above 7% remain attainable in value towns; net returns of 5–6% provide a powerful alternative to traditional fixed income. For households and small investors willing to act with “professional landlord” precision, HDB flats are not just public housing—they are a durable, inflation-defensive pillar of passive income and multi-generational wealth.
The future belongs to those who treat HDB rental not as a windfall, but as a long-term, strategic business—where patience, prudence, and platform mastery ensure resilience through both market cycles and policy evolution.